Running tests and reviewing reports
Run a suite
- Select Run in the header.
- Select a suite from Run Target.
- Confirm that the Connection panel shows the intended environment. In Manage connections, it is marked Selected.
- Choose Background (shown as Local during local development), Docker when enabled, or Browser from the execution selector.
- For Background or Docker execution, confirm that the environment is connected. For Browser, confirm that the environment has a D365 URL and that the Testgrity Recorder extension is installed and detected.
- Select Run suite to start immediately.
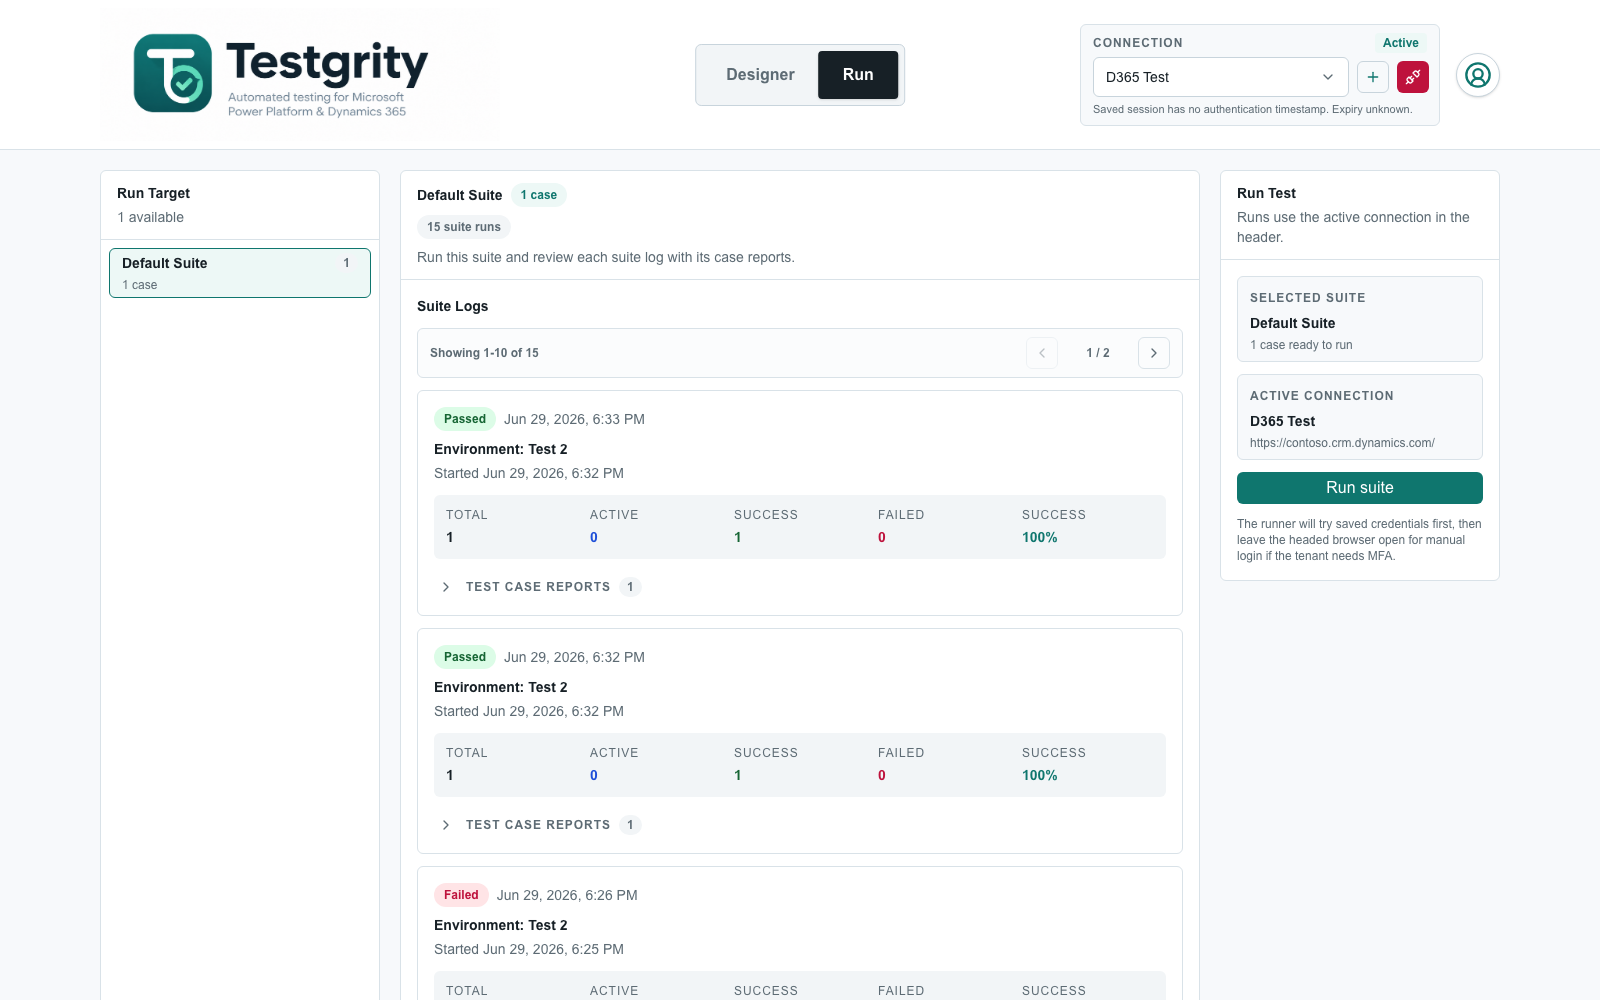
The portal starts the suite with the selected runner, queuing Background runs for an execution worker. You can start multiple suites. If execution capacity is in use, additional test cases remain queued and start automatically when capacity becomes available.
Schedule a suite
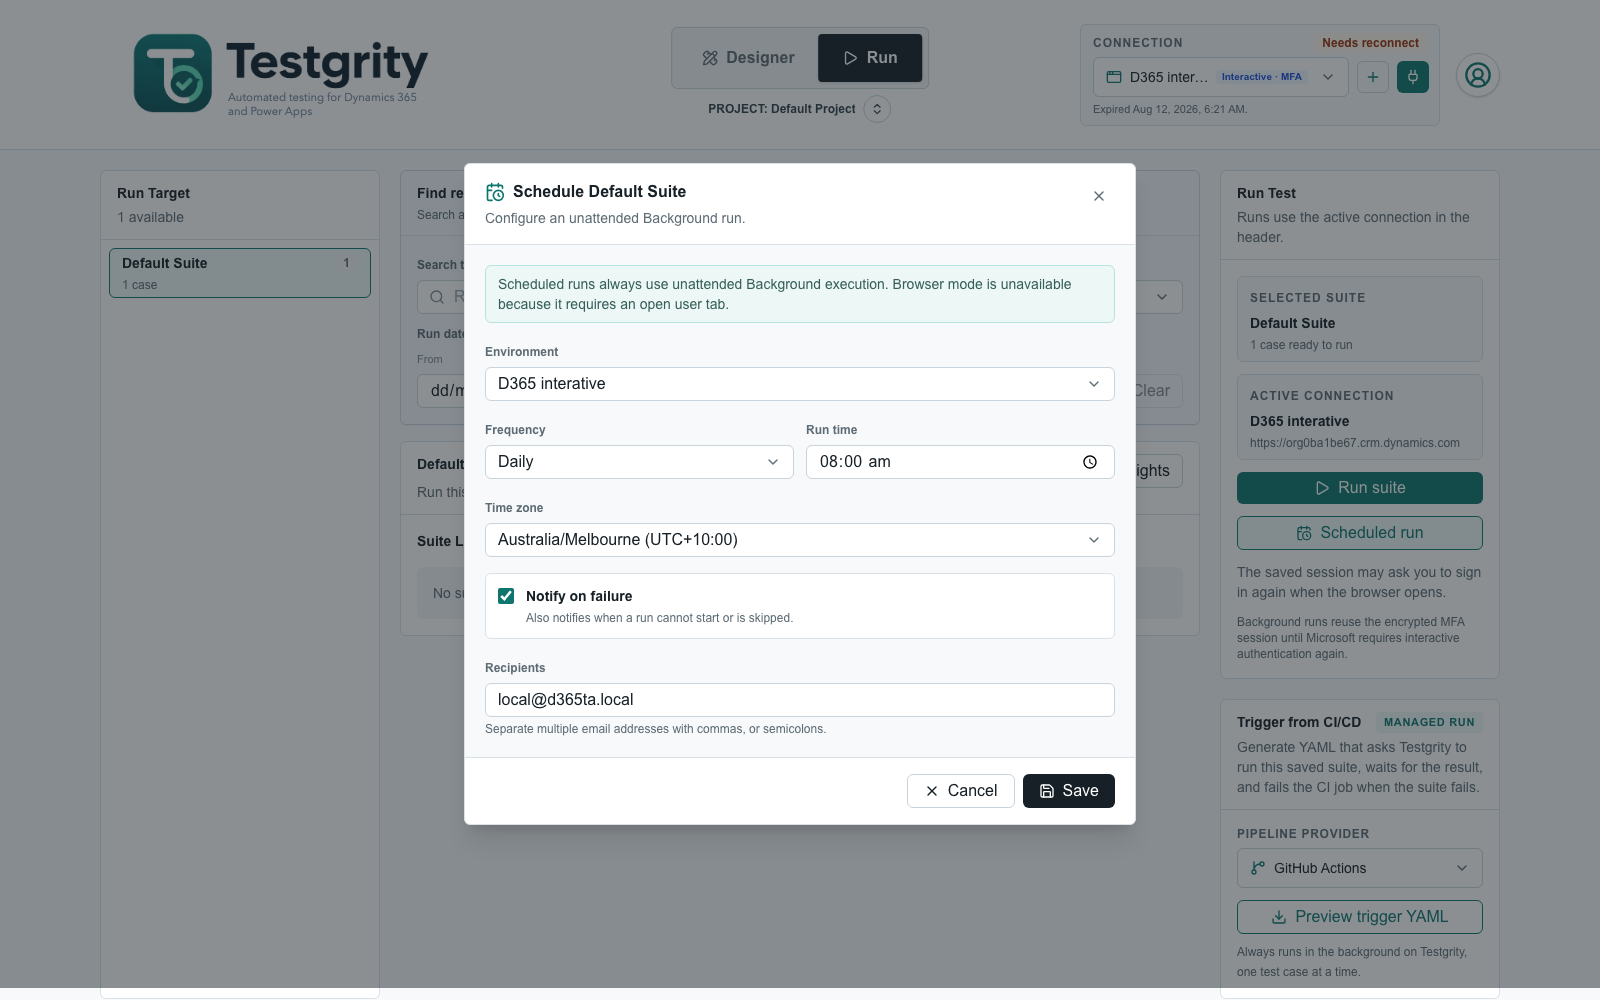
Select an unattended execution mode (Background, Local, or Docker), then select Scheduled run to open the scheduling form. The button is hidden for Browser execution because Browser runs require an open user tab. Scheduled runs support one-time, daily, and weekly recurrence in an IANA time zone. Choose an environment with a saved background session, select the local date or weekday and time, and optionally add failure-notification recipients. Use Add schedule to configure more than one schedule for the same suite.
Scheduled execution is Background-only because Browser runs require an open user tab and extension. Each schedule creates its next occurrence in Suite Logs as Queued. Future queued occurrences do not consume the user's active-run slot. When an occurrence becomes due, it starts as soon as the user's current run finishes; recurring schedules then add their next queued occurrence. Use Turn off schedule to cancel the selected schedule's future occurrence.
Run in Browser
Browser sends the suite to the Testgrity Recorder extension and runs it sequentially in the current Chrome or Edge profile. This mode uses the D365 session in your browser instead of Testgrity's saved automation session, making it useful for MFA, interactive debugging, and environments that cannot use stored automation credentials.
Cases with an execution persona use that persona's encrypted session rather than the connection's default session. A suite may contain cases assigned to different personas; each case receives a fresh browser context for its selected identity. Run these suites with Background execution. Browser execution cannot enforce a case persona because it uses the current browser profile.
When the run starts, Testgrity opens a D365 tab. Keep that tab open until every case finishes. The extension displays the final passed or failed result, starts a 7-second countdown, and then closes the test tab automatically.
When video recording is enabled, the D365 tab waits before the first step. Select the Testgrity extension button once to authorize tab capture and start the run. Chrome and Edge require this explicit user action. The extension records a separate WebM video for each test case.
Browser execution currently supports common recorded actions, including opening apps and navigation targets; opening records, tabs, command buttons, and Save; setting and clearing fields; keyword filtering; key presses; waits; and text or field-value checks. If a case contains an unsupported action, that step fails with a message identifying the unsupported action. It does not fall back to another runner.
Press key setup: install or update Testgrity Recorder to version 0.4.2 or later, accept its new debugger permission if prompted, and reload existing Dynamics 365 tabs. An unpacked development extension must be reloaded from the browser's extensions page. The extension uses browser-level keyboard input, attaches only for the key press on the managed run tab in the selected environment, and detaches afterward. Chrome or Edge may display a debugging banner. Close DevTools on the test tab if attachment fails. If your organisation blocks debugger access, use Background execution instead; Browser execution reports a failure rather than pretending the key worked.
Key presses act on the currently focused control, and shortcuts vary by control and app. A successful Press key step means the browser accepted the keyboard input, not that a record was saved or another business outcome occurred. Focus the intended control first, then add a suitable wait and verification step to confirm the result.
Browser runs create screenshots and videos according to workspace settings. When trace generation is enabled, Browser mode creates a Testgrity browser-diagnostics ZIP containing the step timeline, page URLs, results, errors, and artifact links. It is intentionally distinct from a Playwright trace because the extension does not run inside a Playwright browser context. Browser results also receive HTML and JSON summaries generated by the Playwright reporters after the extension finishes each case. Background execution remains the recommended mode for unattended and parallel runs and genuine Playwright traces. Browser execution remains sequential in the current browser profile.
Interactive connections can also run in the background while their encrypted MFA-authenticated session remains valid. If Microsoft redirects a worker to sign-in, MFA, or Conditional Access, Testgrity stops the run, marks the connection as expired, and asks you to reconnect it in the browser before trying again.
Trigger a suite from CI/CD
The Run view can export a managed-run trigger for GitHub Actions or Azure DevOps. Select a suite and connection, choose the CI provider, and preview, copy, or download the generated YAML. CI/CD always runs the saved suite in the background on Testgrity, one test case at a time, regardless of the manual execution mode selected. The pipeline waits for the result and fails when the suite fails or is cancelled. Interactive connections must have a saved background session; reconnect the connection if prompted before exporting.
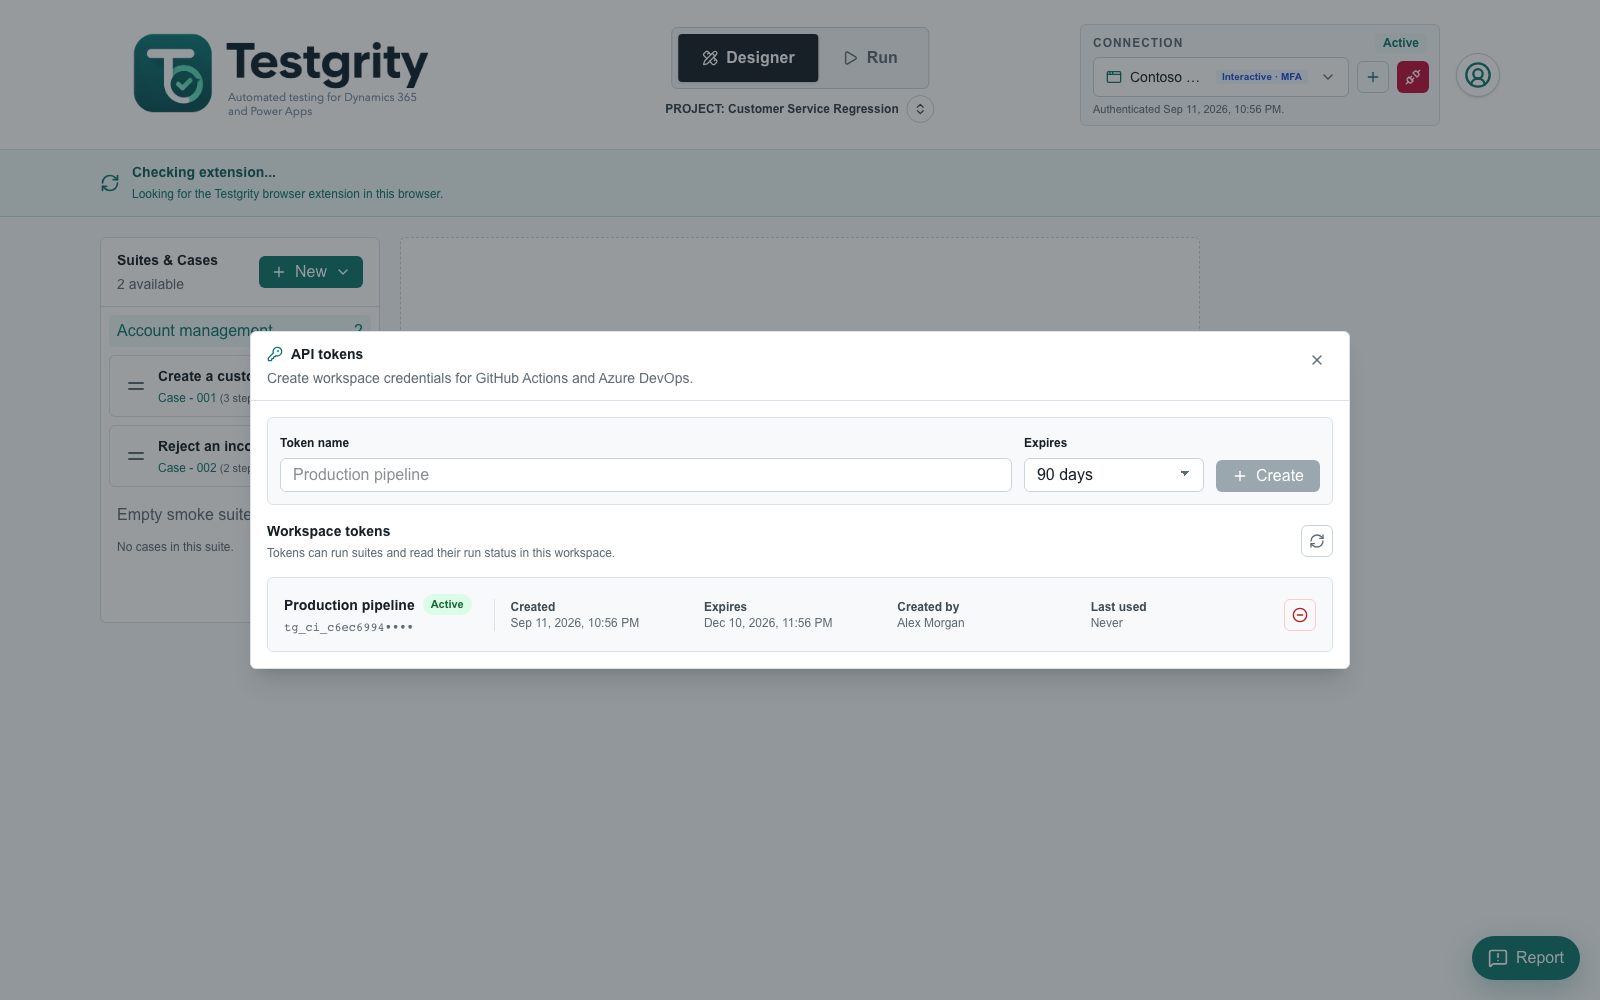
A workspace owner or administrator must create the pipeline credential:
- Open the profile menu and select API tokens.
- Enter a descriptive name, choose an expiry, and select Create.
- Copy the full token immediately. It is shown only once.
- In GitHub, save it as an Actions repository secret named
TESTGRITY_API_TOKEN. In Azure DevOps, use a secret pipeline variable with that same name.
The token can run suites and read their status only in the workspace where it was created. Return to API tokens to see when it was last used or revoke it immediately. API tokens are shared workspace credentials: every workspace owner and administrator can view and revoke them, while members cannot open API-token management. The list shows who created each token for attribution. Revoking a token stops every pipeline that still uses it.
Connect issue trackers and create defects
Workspace owners and administrators can open Integrations from the profile menu and add a GitHub, Azure DevOps, or Jira Cloud connection. During setup, select one or more Testgrity projects that should use the connection. Each project can use one issue-tracker connection; projects can share a destination or use different providers and destinations. Assigning a project to a new connection moves it from its previous connection.
Use Edit → Verify connection to test the currently entered destination and credential without saving changes. Use Disconnect to stop a connection while retaining its settings and project assignments, then use Connect to verify and re-enable it. Use Delete to permanently remove its saved credential and assignments. Deleting a connection does not delete bugs already created in the external provider.
Select Create bugs automatically to create a defect when a test result ends
in failed. Testgrity creates one defect per stable failure fingerprint. A later
run with the same failure adds a comment to the existing defect instead of
creating a duplicate. The run report displays the external defect link and its
occurrence count.
If automatic creation is disabled, a failed run report displays Create bug when its project has a connected destination. Review or edit the generated title and description, then create the bug manually. The same fingerprint rules prevent duplicate bugs and link repeat failures to the existing defect.
Generated defects include failure context, reproduction steps, and links to available evidence. Recorded step values are excluded by default. Review test names, comments, targets, and error messages to ensure they do not contain credentials or confidential customer data.
Monitor or cancel a run
Suite and case statuses update through these states:
- Queued — waiting for a worker.
- Running — the automation runner is executing the test.
- Passed — the observed outcomes matched the expected outcomes.
- Failed — at least one result did not match expectations or execution failed.
- Cancelled — cancellation was requested before completion.
The suite log uses a light status colour to distinguish Passed, Failed, Cancelled, and active runs. It shows the environment, execution method, total, active, passed, and failed cases plus the success rate. The method is Background, Local, Docker, or Browser; runs created before method tracking was added show Unknown. Each suite log displays a readable monospace run ID in the top-right area, such as RUN-20260719-0029. The date-based, workspace-scoped sequence makes a run easy to reference when discussing results or troubleshooting, while Testgrity retains its internal identifier separately. Open the three-dot menu on an active run and select Cancel run to request cancellation. An action already in progress may take a short time to stop.
Expand Test Case Reports while a case is running to see its live step progress. The case card shows the number of completed steps, the total number of steps, and a percentage. Progress updates as each step finishes; the Report button becomes available after the case reaches a final status.
Suite logs are loaded 10 per page. Use Find reports to search by run ID or environment, filter by status or run date, and select Clear to return to the complete suite history. Search and filters run on the server, so they cover older pages as well as the currently visible logs. Use the previous and next buttons to move through the matching runs.
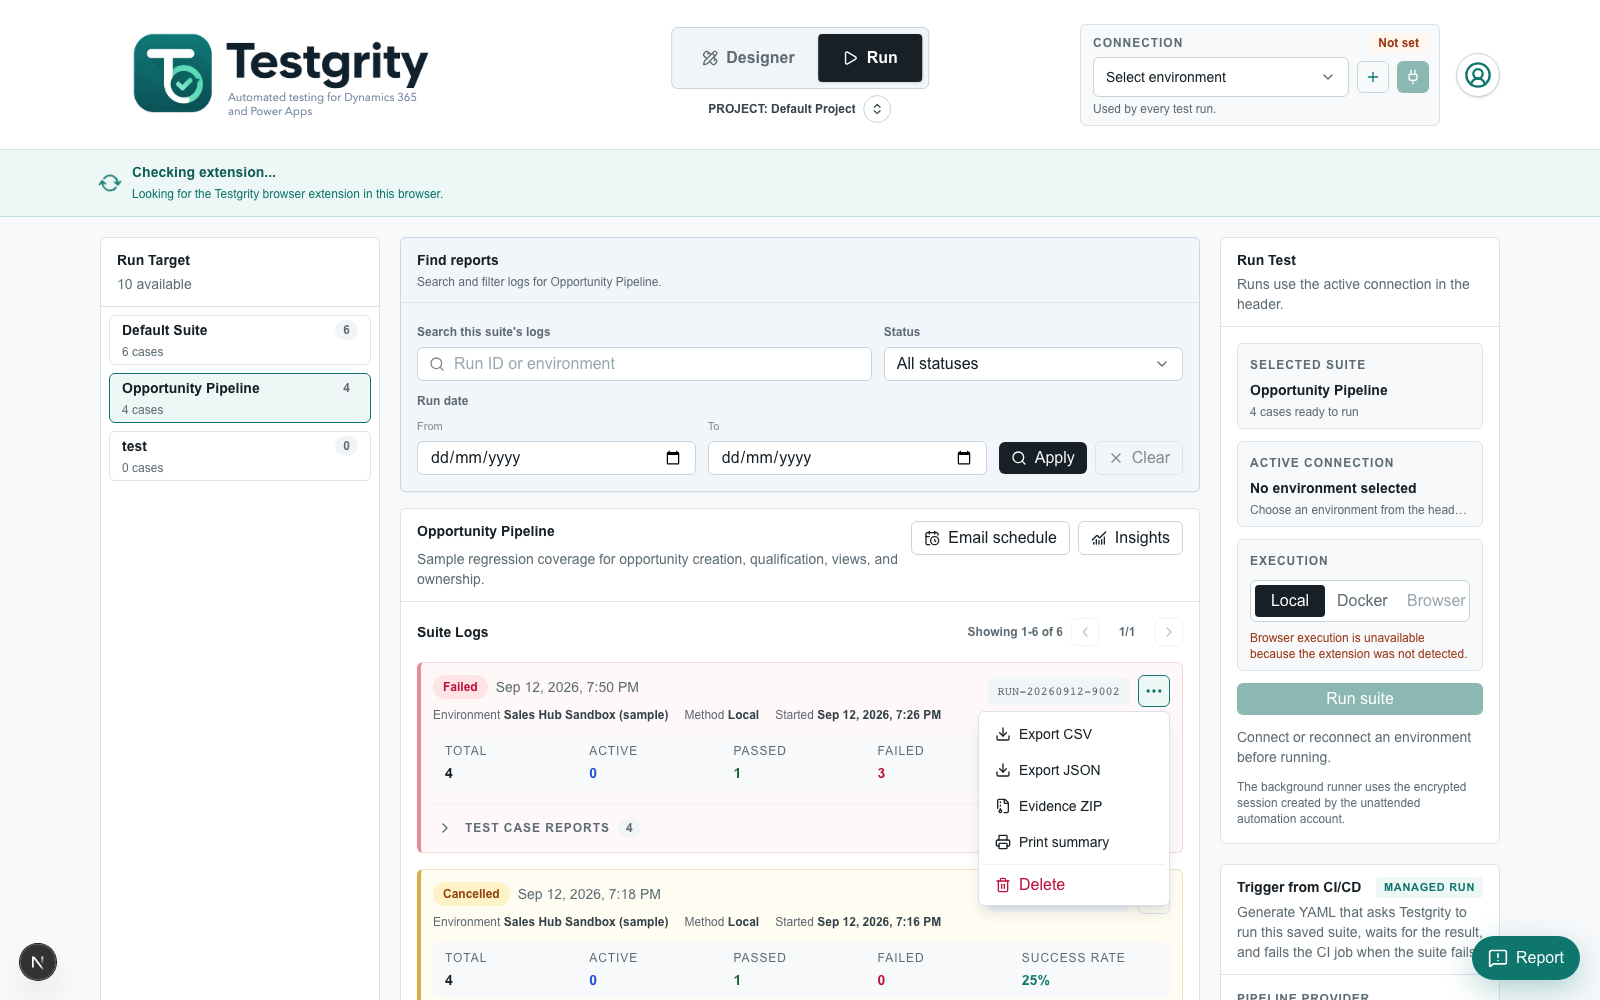
Open the three-dot menu beside a run ID to access its actions. Completed suite logs provide:
- Export CSV — one row per case result for spreadsheet analysis.
- Export JSON — complete versioned suite and case result data, including step details.
- Evidence ZIP — CSV and JSON reports, an evidence manifest, screenshots, videos, traces, and native Playwright report files that are still retained. The manifest records any expected artifact that could not be included.
- Print summary — a concise executive view suitable for printing or saving as PDF.
- Delete — permanently removes the completed suite log, all case reports, and every related attachment.
Active runs provide Cancel run instead and must be cancelled or allowed to finish before deletion.
Review suite insights
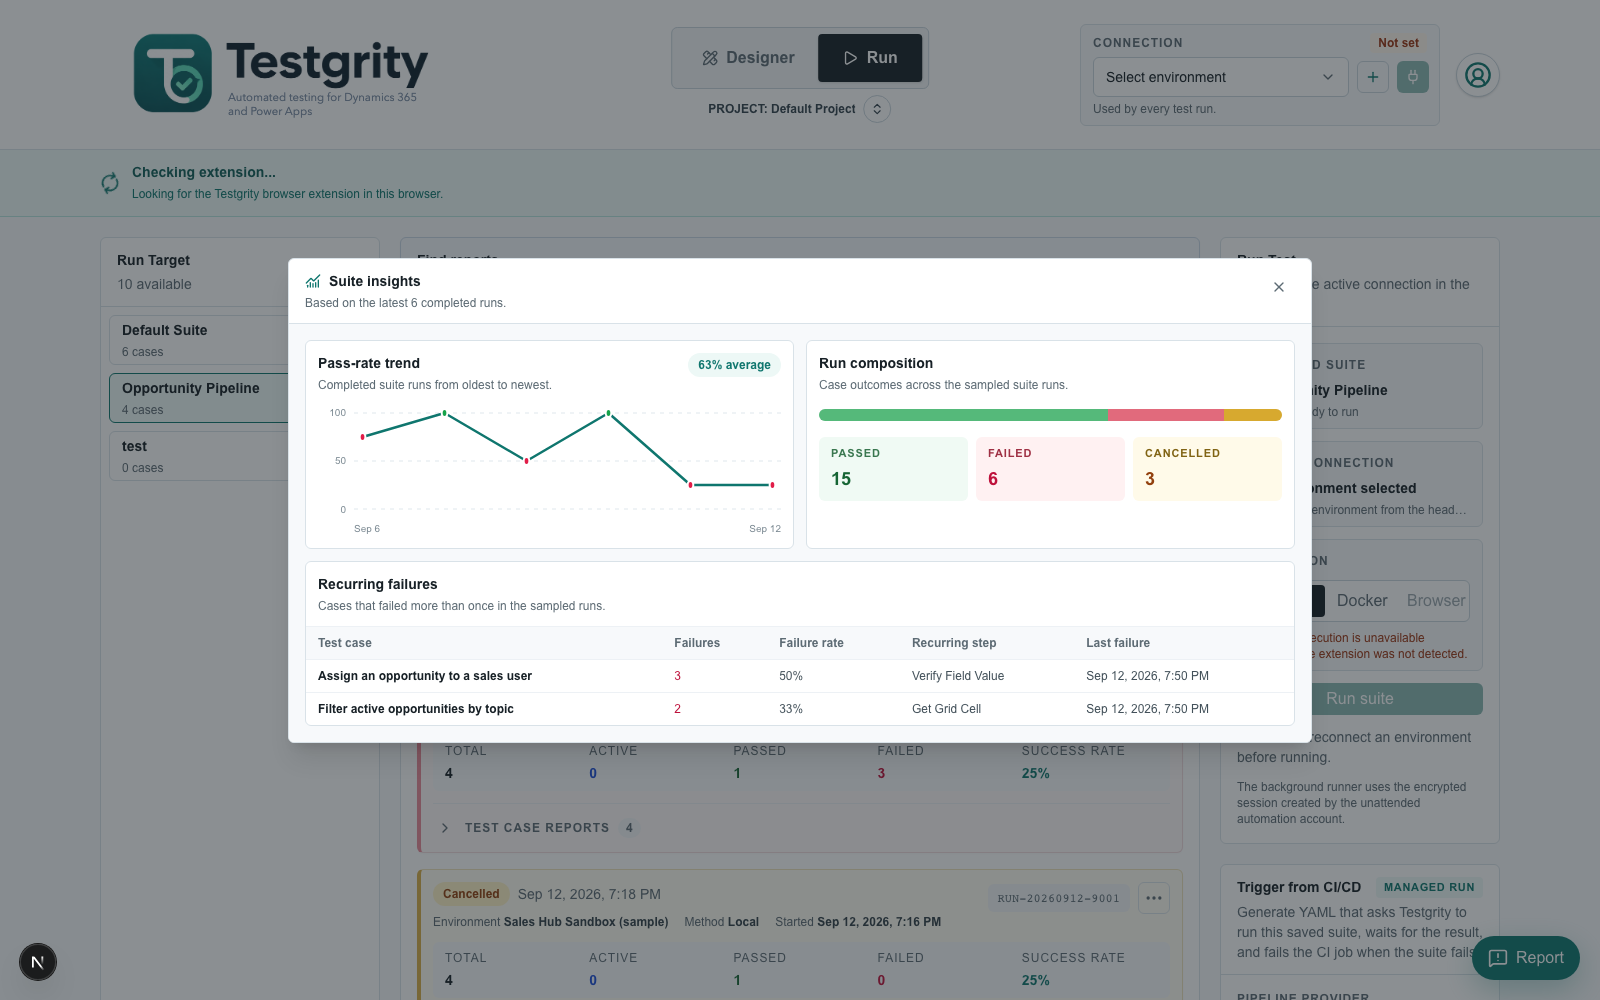
Select Insights beside the selected suite name to analyse its latest 10 completed runs without pushing the run history farther down the page. The dialog includes:
- Pass-rate trend — the success rate for each sampled run, oldest to newest.
- Run composition — the total Passed, Failed, and Cancelled case outcomes across the sample.
- Recurring failures — cases that failed more than once, including their failure rate, recurring step, and latest failure.
Cancelled outcomes remain visible in the composition and are not counted as failed cases. Close the dialog to return to the suite logs.
Schedule report emails
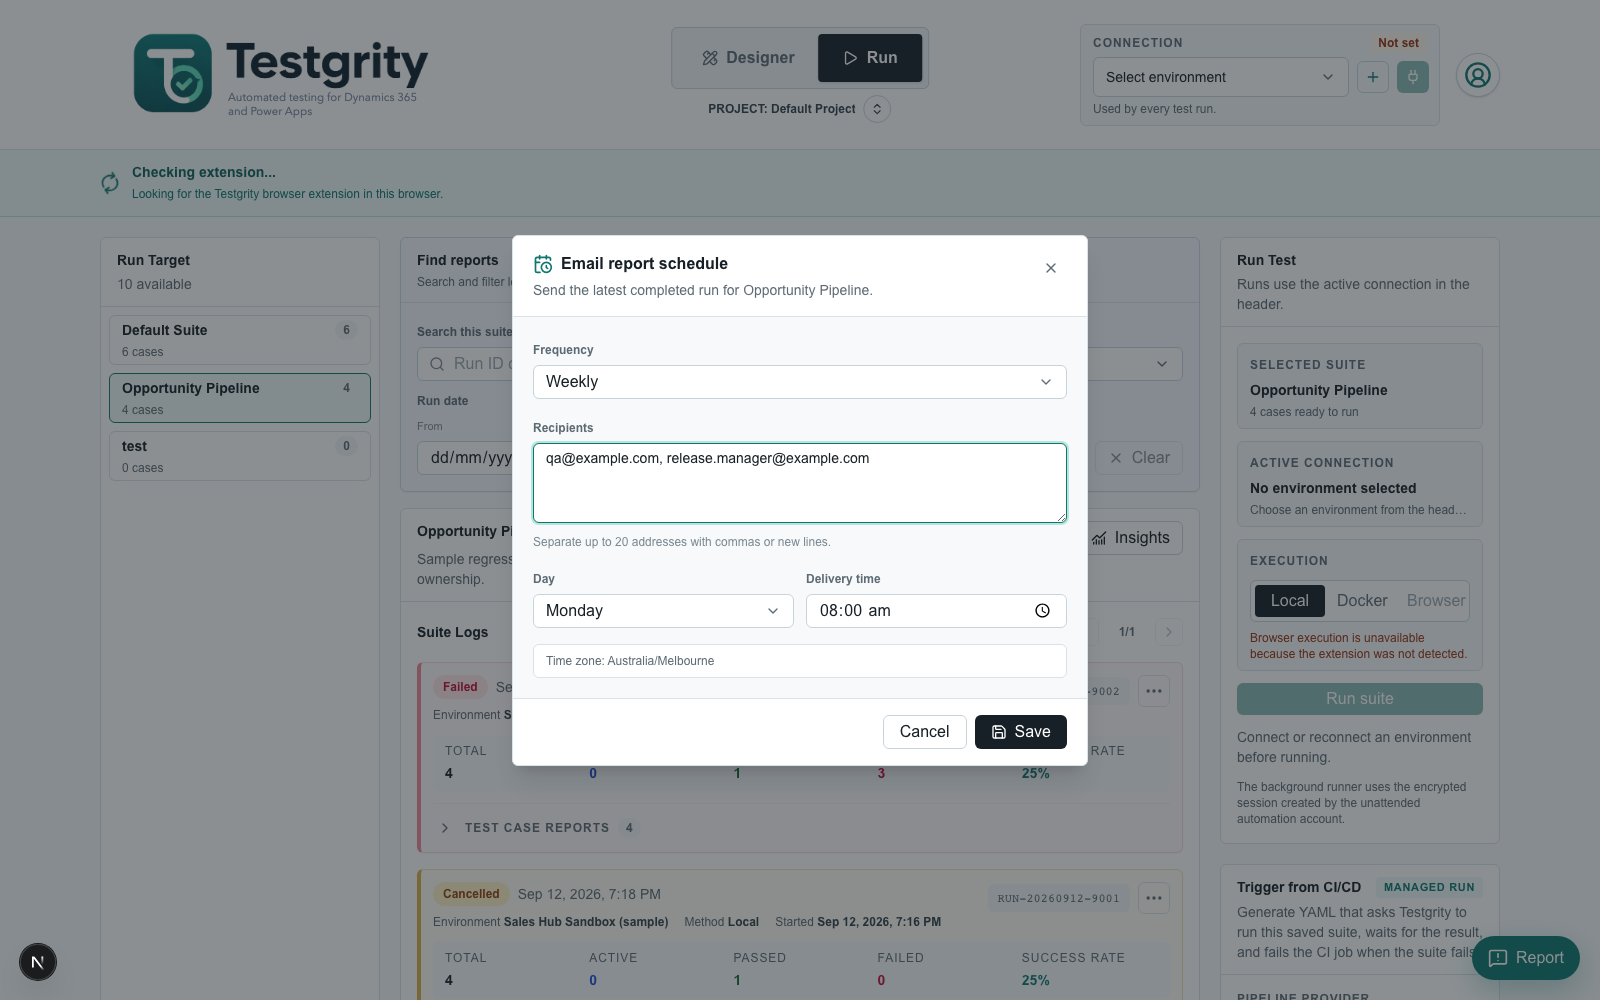
Select Email schedule beside the suite name to send the latest completed run on a daily or weekly schedule.
- Choose Daily or Weekly. Choose Off to stop scheduled delivery.
- Enter up to 20 recipient email addresses, separated by commas or new lines.
- For a weekly schedule, choose the delivery day.
- Choose the local delivery time. Testgrity displays the time zone used for the schedule.
- Select Save.
The email contains the run status, key totals, cases requiring attention, and a sign-in-protected link to the printable summary. Evidence files are not attached to email; recipients open Testgrity to access them. If the suite has no completed run when delivery is due, that delivery is skipped and the next occurrence remains scheduled. The dialog shows the next delivery and the outcome of the previous delivery when available.
Configure run evidence
Open the profile menu and select Settings to choose which evidence is created for future runs.
- Screenshot capture turns screenshots on or off.
- Screenshot mode controls whether screenshots are captured for every step, failed steps only, the final result only, or not at all.
- Video recording turns run videos on or off.
- Generate trace creates a Playwright trace for Background runs and a browser-diagnostics ZIP for Browser runs.
- Run log retention controls how long completed run logs and all of their attached evidence are kept.
Saving a shorter retention period immediately removes expired suite logs, case reports, screenshots, videos, traces, and native reports from the workspace. Capture settings apply to future runs. Run logs and their attachments are retained and removed as one unit.
Open a case report
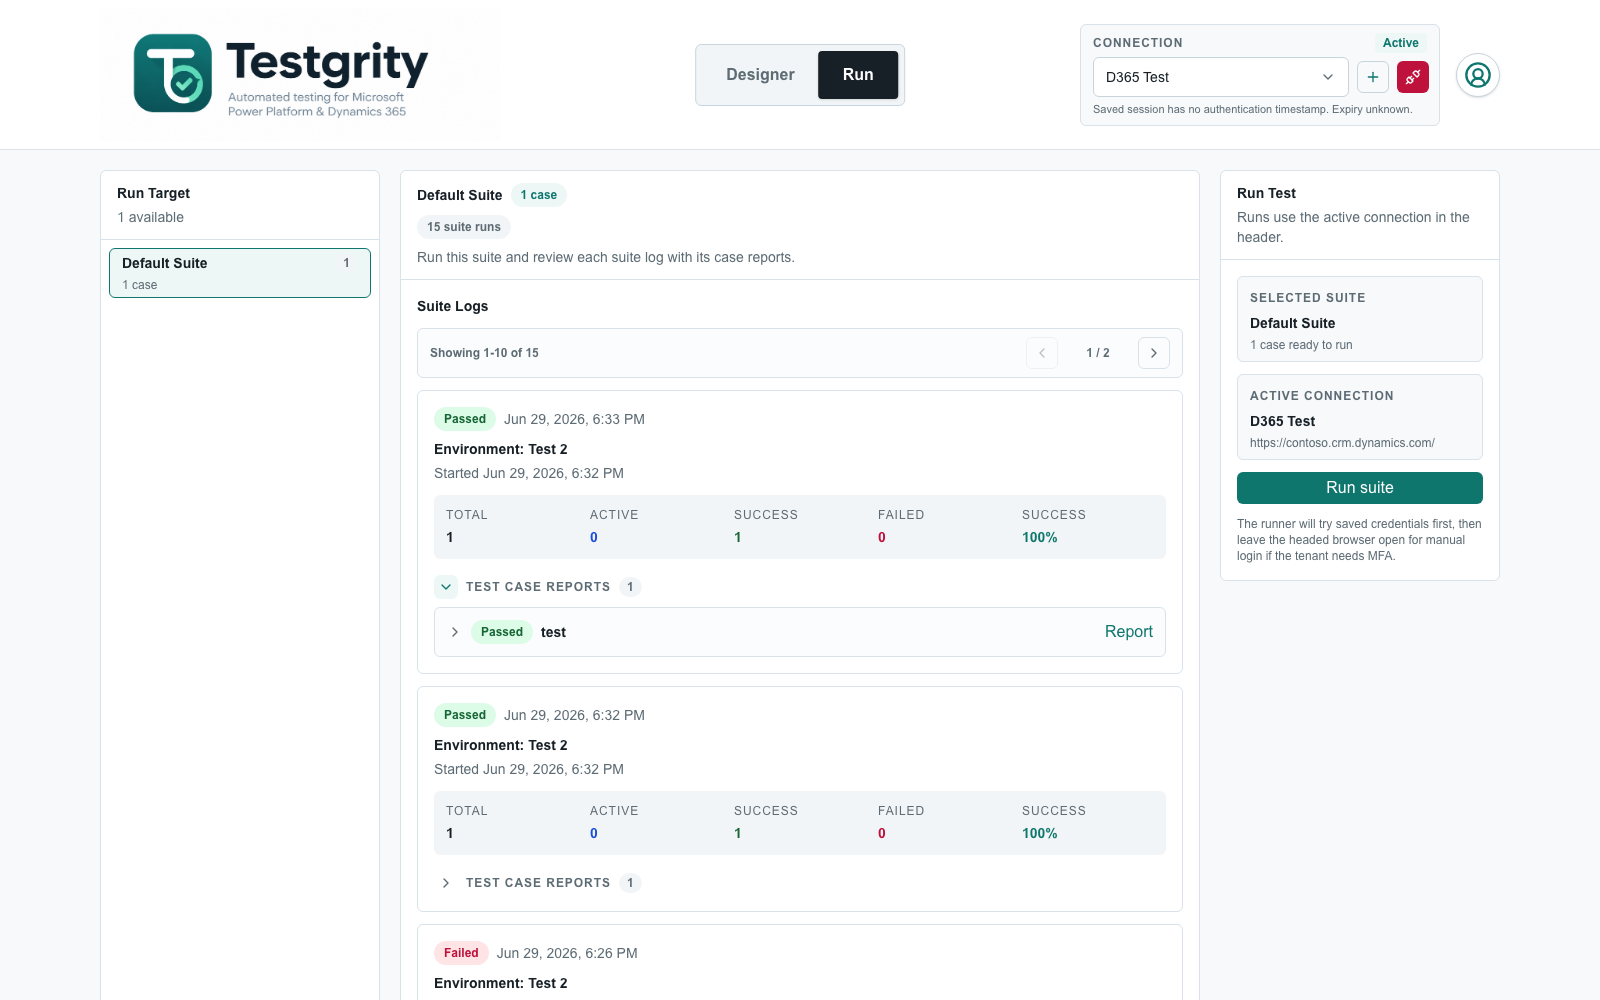
- Expand Test Case Reports beneath a suite log.
- Expand a case for its summary, expected result, actual result, and error message.
- Select Report for the full run report.
Read the full report
The report summarises the run's environment, positive or negative test type, actual status, duration, and step counts. For a failed run, Failure detail shows a concise explanation and lets you expand the underlying technical detail.
Use Export CSV to download one row per recorded step, or Export JSON to download the complete versioned case result and step data.
The Step log contains each action's duration, expected outcome, target, configured value, actual result, and error details. Steps that work with multiple fields list the configured field names and values. Failed steps provide an Observed failure summary and expandable technical detail when available.
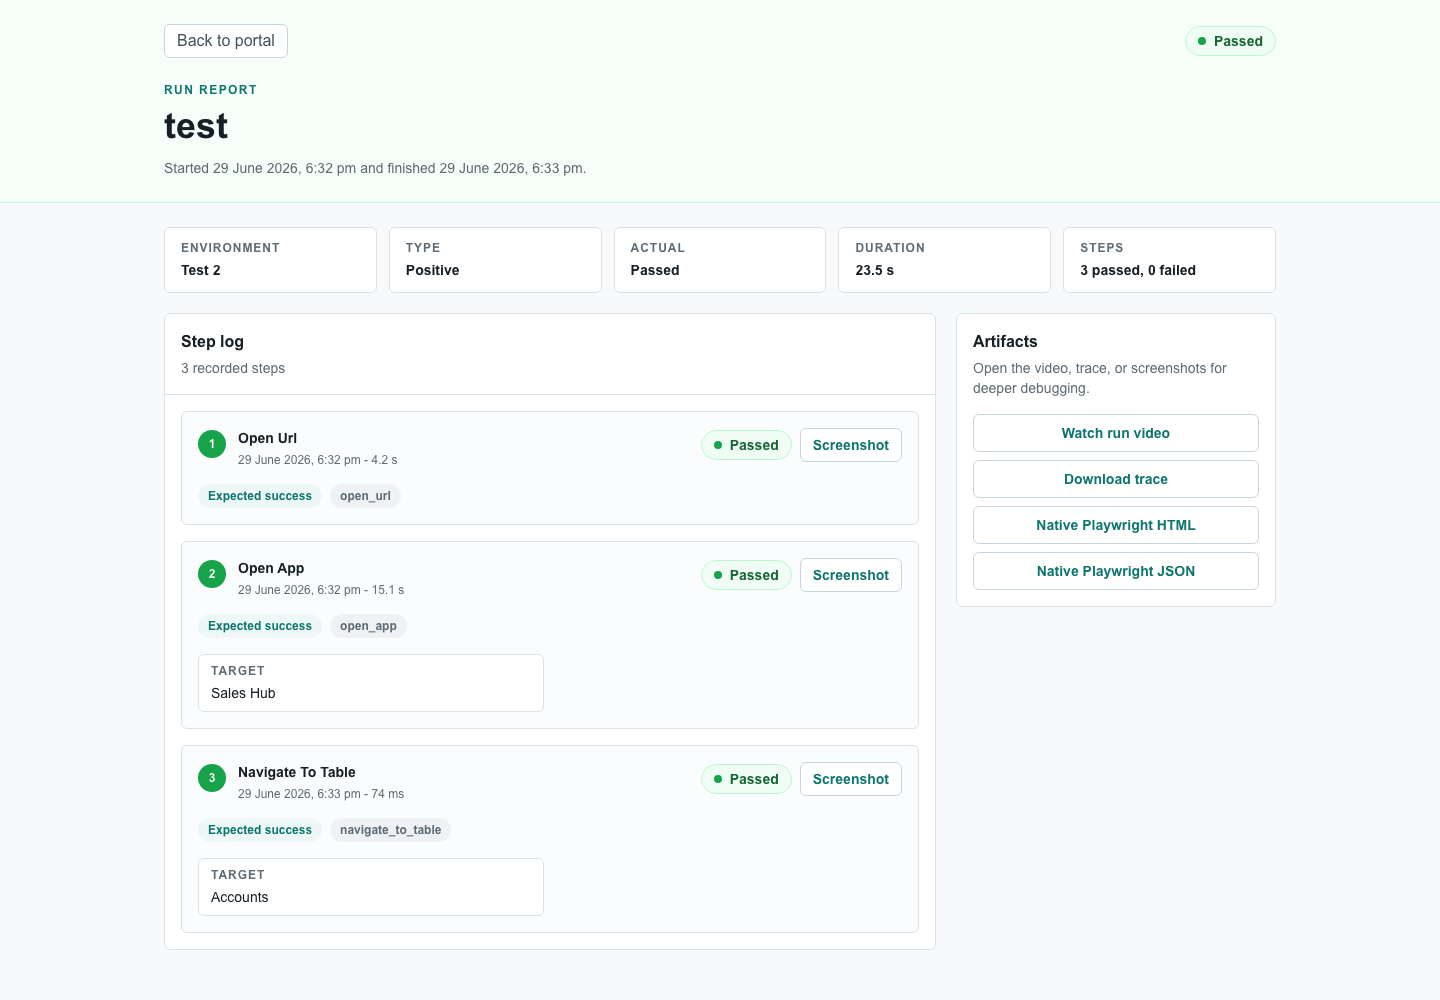
Available evidence may include:
- A screenshot for an individual step.
- A run video.
- A diagnostic trace for timeline, network, console, and page inspection.
- Detailed HTML and JSON execution reports.
Screenshot, video, and trace links are shown when their files are available for the run. Native Playwright HTML and Native Playwright JSON remain visible but disabled when those reports are unavailable. Availability depends on workspace settings, retention policy, deployment configuration, and the runner that executed the test. Use Back to return to the same suite and run context.
Print an executive summary
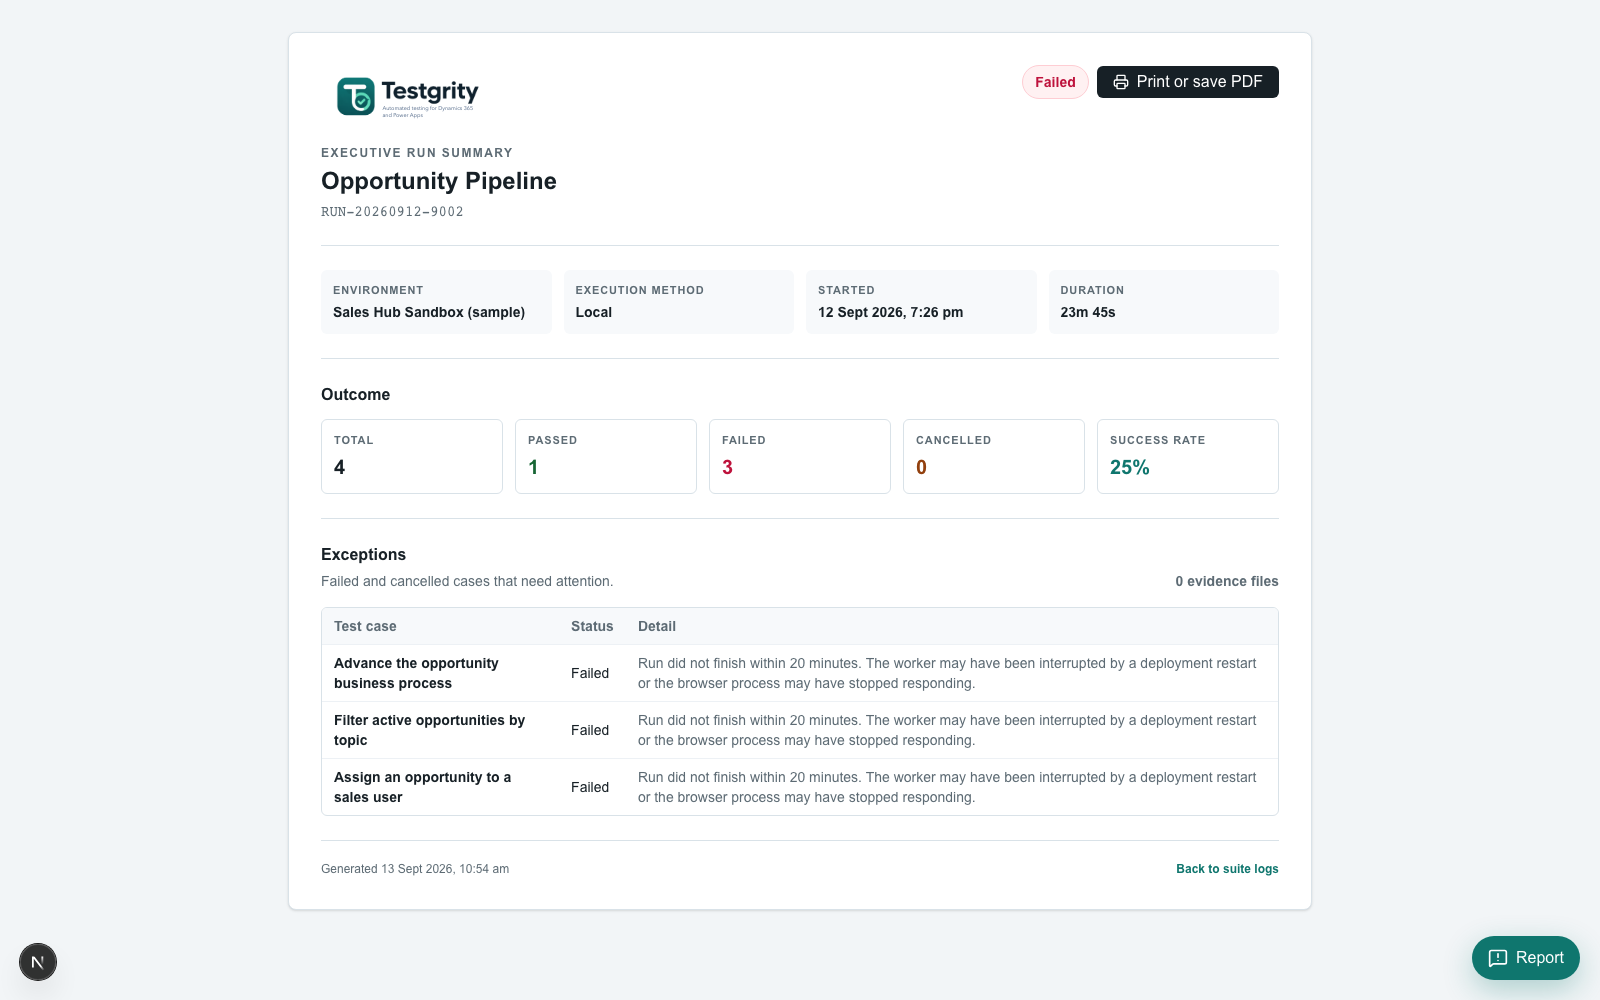
Open the three-dot menu on a completed suite run and select Print summary. The summary opens in a new page with the suite status, environment, execution method, duration, outcome totals, success rate, retained evidence count, and a focused table of failed or cancelled cases. Select Print or save PDF and use the browser print dialog to print the page or create a PDF. Navigation and action controls are hidden automatically in the printed version.
Interpret positive and negative tests
- A Positive test expects every step to succeed.
- A Negative test contains at least one step expected to fail.
- The report passes when observed step outcomes match those expectations.
For example, a validation step marked as expected failure is successful when the application rejects the invalid operation. The report distinguishes the expected failure from an unexpected automation error.